The plan
Spatial imagery provides a point-in-time record of Queensland’s natural and physical assets and environment. It is the key foundation dataset that supports nearly all location-based information analysis and decision-making. It contains measurable data about a feature that enables analysis and mapping without the need to visit the site in person.
We capture imagery from a range of remote platforms including terrestrial (ground-based), remotely piloted aircraft (drone), piloted aircraft, or satellites. To suit a variety of applications, imagery is captured in a range of scales and resolutions.
LiDAR
Light Detection and Ranging (LiDAR) is the primary source of new elevation data in Queensland. This technology uses laser pulses to create detailed 3D maps of the environment. This can then be used to create digital elevation models (DEMs), digital surface models (DSMs), and contours.
Topographical mapping, digital terrain modelling, floodplain mapping, forest canopy height modelling, identification of mineral resources, and monitoring coastal erosion are just some of its many uses. LiDAR data can also be integrated with other GIS data such as aerial photography and satellite imagery, to create more accurate and comprehensive maps.
Projects included in the plan
Programmed projects as part of the plan include:
- annual 10cm resolution imagery covering the following South East Queensland local government areas:
- Noosa
- Sunshine Coast
- Moreton Bay
- Brisbane
- Ipswich
- Logan
- Redland
- Gold Coast
- annual 10cm resolution imagery covering provincial cities, including:
- Toowoomba
- Gympie
- Hervey Bay
- Maryborough
- Bundaberg
- Gladstone
- Rockhampton
- Mackay
- Bowen
- Townsville
- Cairns
- coastal towns at 10cm resolution on a 3-year cycle
- regional coverage at 20cm resolution on a 3-year cycle covering:
- North Queensland Coastal
- Central Queensland Coastal
- Capricorn-Wide Bay
- SEQ Regional
- towns in rural and remote areas at 10cm resolution on a 5-year cycle, unless required more frequently by councils
- Ad-hoc LiDAR projects
- other bespoke acquisition areas as requested by councils, pending funding.
We invite councils and other organisations to contact the Spatial Imagery Coordinator to investigate the feasibility of pooling resources for their projects under the Spatial Imagery Services Program. Due to the economy-of-scale savings possible through the coordinated program, councils and other entities will often see considerable savings compared to if they carried out projects independently.
Maps of capture extents
Select a map to enlarge it.
-

2024 Map of Project Extents awarded -

Cape Towns 2024 10cm -

Capricornia Towns 2024 10cm -

Central Qld Towns 2024 10cm -

Isaac Towns 2024 10cm -

North Qld Coastal 2024 20cm LGAs amended -

North Qld Towns 2024 10cm 1 amended -

North Qld Towns 2024 10cm 2 amended -

North Qld Towns 2024 10cm 3 amended -

Remote Towns North 2024 10cm -

Remote Towns South 2024 10cm -

Rural Towns 2024 10cm amended -

SEQ 2024 10cm amended -

Scenic Rim Towns 2024 10cm -

Torres Strait Islands 2024 10cm amended -

Wide Bay Towns 2024 6cm 10cm


How spatial imagery is used
Information generated from imagery informs public safety and wellbeing, is critical for government functions in maintaining civil society and responding to emergencies, and contributes to initiatives providing economic, social, and environmental sustainability. For many government applications, the use of authoritative imagery in decision-making is critical. Reliance on imagery from unknown sources or of questionable lineage can pose increased risks to communities, assets, and the environment as decisions may be made on out-of-date or unreliable information.
The Queensland Spatial Imagery Acquisition Plan identifies general reference requirements for imagery to support public administration across a range of activities in Queensland. General reference imagery is defined as having the greatest utility for the majority of stakeholders and can change with new technologies and evolving stakeholder needs.
The plan generally undertakes projects with the following resolutions:
- aerial imagery:
- high resolution: 6–10cm
- low resolution: 20cm
- satellite imagery:
- very high resolution: 80cm–1 metre
- high resolution: ~3–4 metres
The graphic below compares the above resolutions in a regional context.
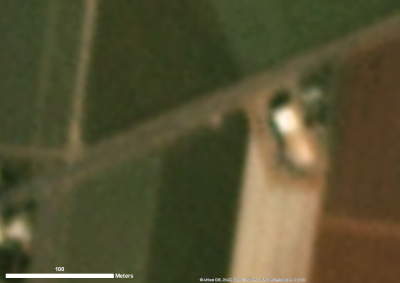
Lower resolution 3 metre Ground Sampling Distance (GSD) satellite image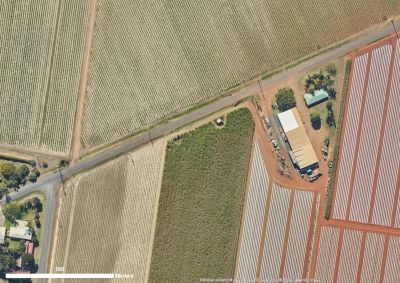
High resolution 10 centimetre Ground Sampling Distance (GSD) aerial image
The resolution of the 3.7m satellite imagery is too coarse at this scale to identify features on the ground. It is ideally suited to broad-scale change detection due to its near-daily frequency, for example vegetation monitoring, flood monitoring, and burn scar mapping. As the image is captured at a coarser resolution, a smaller volume of data is required to cover a large area, and full coverage of the project area can be achieved faster. As a result, the data is easier to store and manage, and deriving insights is more efficient when compared to finer resolution datasets.
The 10cm and 20cm datasets provide greater clarity and additional context such as the location of bike lanes, light poles, and street signs.
- Last updated
- 09 August 2023
- Last reviewed
- 21 February 2023